
The other night I listened to the Lars Schriber podcast with Matt Allington from Excelerator BI. Matt was talking about the early beginnings of Power Pivot in Excel (2013), and how it brought the Excel user with a “good mix of business skills and technical understanding” a new way to share insights. Power Pivot and Power Query in Excel, has proven to be a great enhancement in Excel.
Just two years later (2015), Power BI emerged as a completely new business tool. Although it shared similar technology with Power Pivot, it was a completely different visual approach to sharing insights. I consider myself an Excel diehard, but since Power BI essentially mirrored the same DAX functional language and use of Power Query, I gave it a shot and haven’t looked back!
In this blog series I will share some of the key milestones in my journey that led me from Excel to Power BI. I will include sample data, discuss key concepts, and how we now leverage both in our business today.
This first post will cover getting started in Power Query. The following related posts (Part 2 – 4) will build on the file we create here.
Part 1: Start using Power Query 101, and FREE learning resources!
Part 2: Working with connected data: Excel vs. Power BI.
Part 3: Basic Data Analysis eXpressions (DAX) vs. Excel formulas.
Part 4: Sharing information and data storytelling.
The purpose of this first post is to provide a 15-20 minute hands-on demo to just introduce you to Power Query within Power BI. At the end of all four blog posts, I hope to demonstrate how using Power BI compliments your skillset in Excel, and extends your ability to bring valuable insight to the business.
I’ve attached links to the very small sample sales file called SteppingStone.csv. We aren’t going to get very advanced in any of the blog posts, we are simply going to highlight some key features and get the new user moving in Power BI.
What is Power Query?
Power Query is a program embedded within both Excel and Power BI that at its core helps us reduce the time we spend manually preparing data. The more you use Power Query the more you will discover it does much more than simply help us format rows and columns. The great news about Power Query is that just about anything you’d ever want to do to shape your data can be done with the menu options and buttons in the ribbon. For the rare features that are not available in the menu, I have always found something on the web that helps me write my own query step.
First lets download the free Power BI Desktop program, as well as the small sample CSV file we are going to use in this post.
Download Power BI Desktop for free
Lets begin!
Typically in Excel, we’d open up our CSV file using the well known and very limited Text Import Wizard. We would spend time importing and formatting our data to use in Excel. Then next month, we’d do the same process all over again. This is a great representation of how labor intense working in Excel can be.

The magic of Power Query is that with just your mouse we can record each data preparation step as we import the data in the first time. When the data updates next month, or we receive a new import, we simply refresh the query and re-run those original steps as part of the data refresh process. Much like recording a macro (but on steroids), this program will faithfully do all of your data cleanup whenever you need new information.
Lets give this a try. If you haven’t downloaded Power BI Desktop for free, click here, then save the Stepping Stone Sales file from the download link above to your computer.
After downloading Power BI Desktop, open the program and click on ‘Get Data‘. From here, choose from ‘Text/CSV‘ and browse to the saved sample file SteppingStone.csv file you just saved. Next click on ‘Transform Data‘ option.

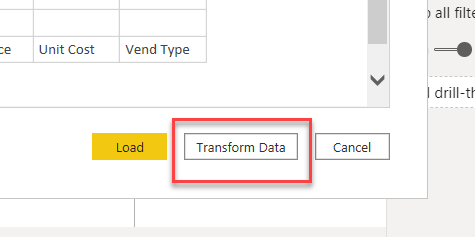
We are now in Power Query, and from here we can make all the formatting changes that we would normally have to do in Excel.
Step1: Lets remove a column that we don’t need. Since Column 9 is just a vendor code, and does not add value to our sales report, lets click and highlight the entire column ‘click on the header name’ and click the ‘Remove Columns‘ menu button. In addition to having a cleaner report, getting rid of excess data (Columns and Rows) will help increase performance in larger reports.

At first glance it may seem that we just permanently deleted this data, but we actually just hid the data from what we will ultimately import into Power BI. By doing so, we’ve freed up valuable space in our final table.
If you ever hide a column by mistake, it is as easy as deleting the step made in error on the far right of the Power Query screen, under ‘APPLIED STEPS‘ below. You can delete the Removed Columns step we just performed on Column 9, and re-remove Column 9 if you would like to see how easy this is.
If you’d like to see each step as it progresses through the query, simply click on the Source step at the top, then each step below to see each change made.

Tip: Make sure you turn on the formula bar to get a sense for the code Power Query is writing on your behalf in the background. By doing so, you will become familiar with the syntax and the functions themselves. For now, don’t worry about learning to understand or write M (Data Mash-up). 80-90% of what I do in Power Query is accomplished using the menu options.

Step2: We notice our header row starts on row 5 below. Lets remove the top 4 rows, then promote the desired row as our header.

Now with our header information placed at the top in Row 1 (below), lets click to ‘Use First Row as Headers‘ in our report.

Step 3: Now we need to eliminate all the other unnecessary spaces and rows in our data. By doing so, we are moving from a raw data import to a well structured data table that we can use in our analysis.
I notice that beyond the header, I am just interested in listing each sales order line that falls under the ‘Doc Type‘ SI. Lets just filter the data like we would in a spreadsheet, however instead of using the filter check boxes, lets use the ‘Text Filters‘ option below to isolate the rows that list “SI” in the column.

I feel it is best to use the ‘Text Filters‘ feature when clicking on column arrows rather than depend on the check boxes listed. Part of the reason is that the data you see in the drop down box (by default) is limited to showing you the options available in the first 1,000 rows of your data. By using the ‘Text Filter’, we ensure we are creating filters that apply to all rows in the report, not just the default first 1,000 rows.
Step 4: Next we notice that our transaction date only appears on the first sales order of the given day. For our table, we need the transaction date to appear in each and every sales row.
Right click over the ‘Trans Date‘ column header name, and choose ‘Replace Value‘. Leave the ‘Value to Find‘ blank (so it fills in the blanks), then in the ‘Replace With‘ box we are going to type the word “null” and click OK. We do this in order to clear the entire cell so that we may replace this empty cell with the dates from above. In this example, we need the date to ‘Fill Down‘ for each null (empty) cell.
Note: If you are unfamiliar with the term null, it basically means that the cell is empty. It is neither a valid value nor is it a blank field. It is a cell format that contains nothing identifiable.

Now that we have our “null” or empty fields in place, lets right click over the ‘Trans Date’ column again, and now use the ‘Fill Down‘ feature.

Step 5: Changing the column data types: As much as possible, I save formatting my columns to the very end of my queries. By doing so, I ensure that any potential column type mis-match error that might creep into future data updates/refreshes won’t impact the query until all the other query steps have successfully processed.
We will talk in a future post about how enforcing a data type for your columns not only help compress your data, but it also helps ensure that all of your data is consistent when used to connect with other table columns in your model.
If for whatever reason a text field creeps into a numeric column, you’ll find out as soon as the data attempts to refresh. The model itself will grind to a halt until you go back into your source data or Power Query and address the invalid data. What appears to a hassle to fix is actually a strength of the product as it insists on data integrity.
For now in our sample file, lets set the data types of each column. Below you should click on the ‘ABC‘ to the left of ‘Trans Date‘ and choose ‘Date‘.
Tip: By choosing ‘Date and Time’ as a combination will unnecessarily slow your model down as your table grows. The issue is asking Power BI to process through every specific date and time combination listed. We will discuss this further in a future post, but cardinality, which is a fancy term that addresses how many different values are listed in one column, is very important when it comes to performance. The more complex and unique values a column has, the harder Power BI must work to compress and work with that column down the road.
Under ‘Doc#‘, we know this should always represent a ‘Whole Number‘. After you change these two columns, look at the other columns and change as indicated below.

Finish up the formatting of the file by changing each column type below to ‘Whole Number‘ or ‘Decimal Number‘ format.

Finish up by clicking on ‘Close & Apply‘ in Power Query. This final step loads your formatted data as a table into Power BI.

Finally, lets save our Power BI file by calling it ‘SteppingStone.pbix‘.
Congratulations, you’ve not only formatted your first Power BI table, but you’ve saved these same steps for the next time new data is available for us to load!
This demo has just scratched the surface of Power Query. If you would like to learn more about added features and uses, check out this FREE video course from SkillWave, or this free book series from Reza Rad that includes Rookie to Rockstar – Book 3 – Power Query and Data Transformation in Power BI.
In the next blog Post 2, we are going to continue developing this report by adding other tables to connect together through table relationships. We’ll explore the concept of the relational data model and filtering and how this type of model ensures data integrity and performance over time.
As always, thank you for reading, and stay tuned for the next post when we work our data in Power BI.
-Mark
Leave a Reply